Home
Weather London
WeatherRadar
RainfallRadar
TemperatureRadar
WindRadar
LightningRadar
Weather News
Editor's Pick
Discover the app
Weather widget
Contact us
Apps
Career
    Home / Editor's Pick /

    Trickier than you think - Why it's hard to pinpoint thunderstorms

09:36
27 May 2026

Trickier than you think
Why it's hard to pinpoint thunderstorms

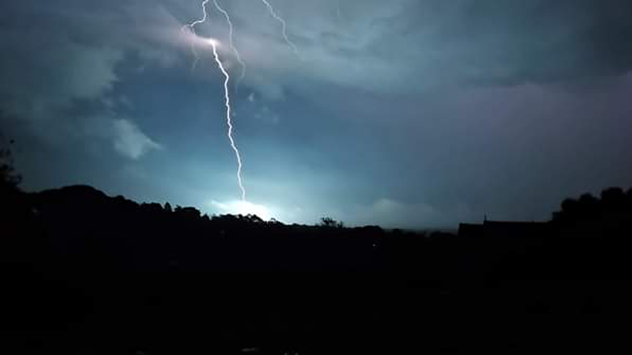
Bright lightning bolt striking beneath dark storm clouds over a silhouetted landscape at night, illuminating the sky with blue-white flashes.
Lightning strikes the ground in Ivybridge, Devon. - © Weather & Radar Uploader

Mentioning a risk of thunderstorms in a forecast often comes with a mixture of feelings. Some of us love them, while others of us are more thankful when they miss our location.

When thunderstorms pop up in forecasts, most of us will check if they're nearby. Instead, finding a thunderstorm warning area with no pinpointed location where the thunderstorm will occur.

This is because locking down the location of a thunderstorm is actually rather difficult before it forms. The best way to explain why is the case is by using an analogy of a saucepan boiling some water.

When boiling water, you know that bubbles will eventually appear when the conditions are right, you just don’t know where they will appear.

This is similar to the prediction of thunderstorms. We can see an area of unstable conditions growing to aid the development of a thunderstorm. We just cannot pinpoint where the exact conditions will be to identify the specific location of the thunderstorm itself.

Once a thunderstorm has been established, we are able to use current weather observation data to update our forecasts to both keep track of the thunderstorm and predict where it will move.

Ryan Hathaway
More on the topic
Heatwave versus storm system. Contrasts in Europe. . . Tuesday, 7 July 2026
A temperature map of Europe showing a major heatwave in the south-west and significantly cooler air in the north. Two thermometer symbols illustrate the stark contrast in temperature.
Tuesday, 7 July 2026

Contrasts in Europe

Heatwave versus storm system
Heat-health alerts ahead of heatwave. Across England. . . Tuesday, 7 July 2026
Temperature map of the UK and western Europe showing hot conditions across Britain, with temperatures reaching 33°C near London, 29°C around Cardiff, 24°C near Liverpool, and a large heat warning symbol highlighting elevated heat risk.
Tuesday, 7 July 2026

Across England

Heat-health alerts ahead of heatwave
Yet another typhoon in the Pacific. Gusts of over 185 mph. . . Friday, 3 July 2026
Wind forecast map of the western Pacific showing a powerful typhoon east of Guam with a well-defined eye, strong wind circulation, and a windsock warning icon.
Friday, 3 July 2026

Gusts of over 185 mph

Yet another typhoon in the Pacific
All weather news
This might also interest you
Storm Chandra makes impact. Severe gales & heavy rain. . . Tuesday, 27 January 2026
Split image showing strong winds over the UK on a forecast map and widespread rain and snow on a weather radar map.
Tuesday, 27 January 2026

Severe gales & heavy rain

Storm Chandra makes impact
New records for England and Wales. Broken again tomorrow?. . . Thursday, 25 June 2026
Temperature map of southwest Britain on 25.06 showing extreme heat across southern Wales and southwest England, with Bute Park in Cardiff highlighted at 34.2°C and Yeovilton at 36.4°C amid widespread deep red heat zones.
Thursday, 25 June 2026

Broken again tomorrow?

New records for England and Wales
Super Typhoon Bavi threatens Taiwan. Up to 1,000 mm of rain. . . Wednesday, 8 July 2026
The image shows an intense tropical cyclone over the western Pacific, east of Taiwan and the Philippines. The centre of the system is depicted as a light purple and white vortex with a clearly visible eye, surrounded by a ring of red and orange areas indicating the strongest wind speeds. A white arrow marks the typhoon’s predicted track towards the north-west, in the direction of Taiwan. To the west of the storm lie the Philippines, with the cities of Manila and Cebu; to the north of these lies Taiwan, with Taipei. Further west, the Chinese coast, including Hong Kong, and parts of Vietnam can be seen. The coloured wind map shows predominantly green areas outside the storm’s core, indicating significantly weaker winds. White streamlines illustrate the typhoon’s anti-clockwise circulation in the Northern Hemisphere. The highest wind speeds are concentrated around the eye of the cyclone.
Wednesday, 8 July 2026

Up to 1,000 mm of rain

Super Typhoon Bavi threatens Taiwan
All articles
Weather & Radar

Weather & Radar is also available on

Google Play StoreApp Store

Company

Contact us Privacy Policy Legal info Accessibility statement

Services

Uploader

Socials

facebooktwittertikToklinkList