Home
Weather London
WeatherRadar
RainfallRadar
TemperatureRadar
WindRadar
LightningRadar
Weather News
Editor's Pick
Discover the app
Weather widget
Contact us
Apps
Career
    Home / Editor's Pick /

    Seeking the truth: Extreme heat, or extreme headlines?

12:00
5 July 2022

Seeking the truth
Extreme heat, or extreme headlines?

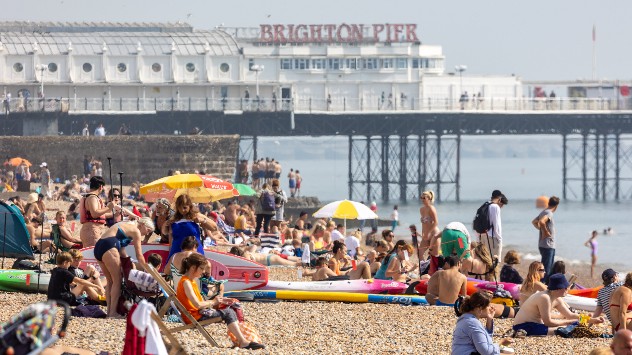
Sunbathers at Brighton Pier in a heatwave last year
© picture alliance

A heatwave is on the horizon, but how severe is it really looking?

Through the week, temperatures will be gradually on the rise as high pressure begins to build in from the south-west.

Depending on the exact placement of the high and the jet stream, there is the chance that we could draw up even more heat from the southern European continent.

Whilst weather models at present are trending with temperatures rocketing to around 30C next week, one publicly available weather model, has been showing something a little more severe, with a few alarming 40C figures popping up in there.

This is the first time any operational model run has shown 40C across the British Isles, so has consequently received major media attention.

However, there a lot of considerations that need to be taken before jumping to any conclusions:

  • These significantly high temperatures are still 10-14 days out. Weather models become inherently inaccurate this far into the future, and are only reliable with such detail a couple of days out
  • There are several weather models, each producing several different (and less extreme) outputs a day that many people do not get to see; the significantly higher values are an outlier and not an indication of the average trend
  • Weather model outputs are not a forecast, just a possibility from a range of scenarios
  • The weather is highly changeable in the British Isles; many factors would need to align to produce such extreme heat

Unfortunately, is not impossible for temperatures to soar to 40C in the British Isles. Such temperatures are now a realistic probability during the summer, especially in theme with recent record-breaking heat across the rest of Europe.

It’s still far too early to say whether this has any truth in it, but rest assured, we’ll be providing honest forecast updates as the week goes on.

You can keep an eye on our TemperatureRadar up to three days ahead too.

Weather & Radar editorial team
More on the topic
Drought across large parts of Europe. High fire risk. . . Monday, 20 July 2026
Split image showing a Europe rainfall anomaly map on the left with widespread dry conditions across much of the continent, and a cracked, parched field on the right alongside a wildfire warning symbol highlighting elevated fire risk.
Monday, 20 July 2026

High fire risk

Drought across large parts of Europe
New heatwave in southern Europe. Up to 45 degrees in Spain. . . Tuesday, 21 July 2026
Split temperature map showing extreme heat across Spain on the left and Greece on the right, with temperatures reaching 44°C near Murcia, around 40°C in parts of Greece, and a large thermometer icon highlighting dangerous heat.
Tuesday, 21 July 2026

Up to 45 degrees in Spain

New heatwave in southern Europe
Drought for North Wales and Upper Severn. 2% of average rainfall. . . Thursday, 23 July 2026
Split image showing a July rainfall anomaly map of Europe on the left with below-average rainfall across the UK, Ireland, and much of western and central Europe, and an active moorland wildfire on the right producing flames and thick smoke near homes.
Thursday, 23 July 2026

2% of average rainfall

Drought for North Wales and Upper Severn
All weather news
This might also interest you
Super Typhoon Bavi threatens Taiwan. Up to 1,000 mm of rain. . . Wednesday, 8 July 2026
The image shows an intense tropical cyclone over the western Pacific, east of Taiwan and the Philippines. The centre of the system is depicted as a light purple and white vortex with a clearly visible eye, surrounded by a ring of red and orange areas indicating the strongest wind speeds. A white arrow marks the typhoon’s predicted track towards the north-west, in the direction of Taiwan. To the west of the storm lie the Philippines, with the cities of Manila and Cebu; to the north of these lies Taiwan, with Taipei. Further west, the Chinese coast, including Hong Kong, and parts of Vietnam can be seen. The coloured wind map shows predominantly green areas outside the storm’s core, indicating significantly weaker winds. White streamlines illustrate the typhoon’s anti-clockwise circulation in the Northern Hemisphere. The highest wind speeds are concentrated around the eye of the cyclone.
Wednesday, 8 July 2026

Up to 1,000 mm of rain

Super Typhoon Bavi threatens Taiwan
Turbulent weather in the Canary Islands. Storm and rain. . . Friday, 12 December 2025
Weather graphic showing rain and wind fields over the Canary Islands and a central warning symbol.
Friday, 12 December 2025

Storm and rain

Turbulent weather in the Canary Islands
Flooding, gales, and heavy snow. Storm Chandra. . . Tuesday, 27 January 2026
Split image showing aerial flooding in a town with muddy water covering roads on the left, and a rural road on the right blocked by heavy snowfall with vans stopped and a person walking in snow.
Tuesday, 27 January 2026

Storm Chandra

Flooding, gales, and heavy snow
All articles
Weather & Radar

Weather & Radar is also available on

Google Play StoreApp Store

Company

Contact us Privacy Policy Legal info Accessibility statement

Services

Uploader

Socials

facebooktwittertikToklinkList