Home
Weather London
WeatherRadar
RainfallRadar
TemperatureRadar
WindRadar
LightningRadar
Weather News
Editor's Pick
Discover the app
Weather widget
Contact us
Apps
Career
    Home / Editor's Pick /

    Sun cream at the ready! Very high UV levels during the heatwave

08:41
8 July 2026

Sun cream at the ready!
Very high UV levels during the heatwave

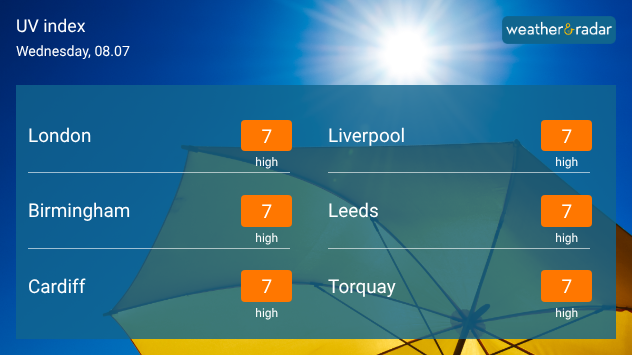
UV index forecast graphic for Wednesday 08.07 showing high UV levels of 7 in London, Birmingham, Cardiff, Liverpool, Leeds, and Torquay beneath bright sunshine.
Widespread high levels of UK to end the week.

Heatwave number three is taking hold of England and Wales to end the week, bringing with it a return of very high UV levels too.

Naturally, the areas with the hottest daily highs, found mostly in south-east England, will also see the strongest levels in the coming days.

Despite remaining slightly cooler in Scotland and Ireland, with cloud cover too, UV can penetrate gloomy skies so it is still wise to keep an eye on levels.

Applying sun cream in the morning, with regular top-ups during the day is the best active protection against sun damage. While avoiding the midday sun, where levels peak, is also encouraged.

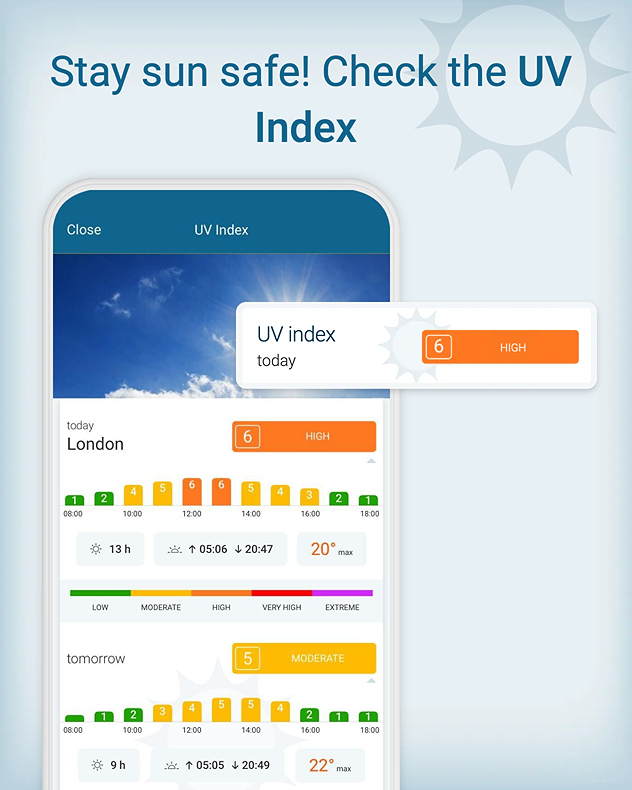
Mobile app screen showing UV index forecast for London with peak value 6 labeled high, hourly scale in orange and green, and headline text advising to check the UV index.
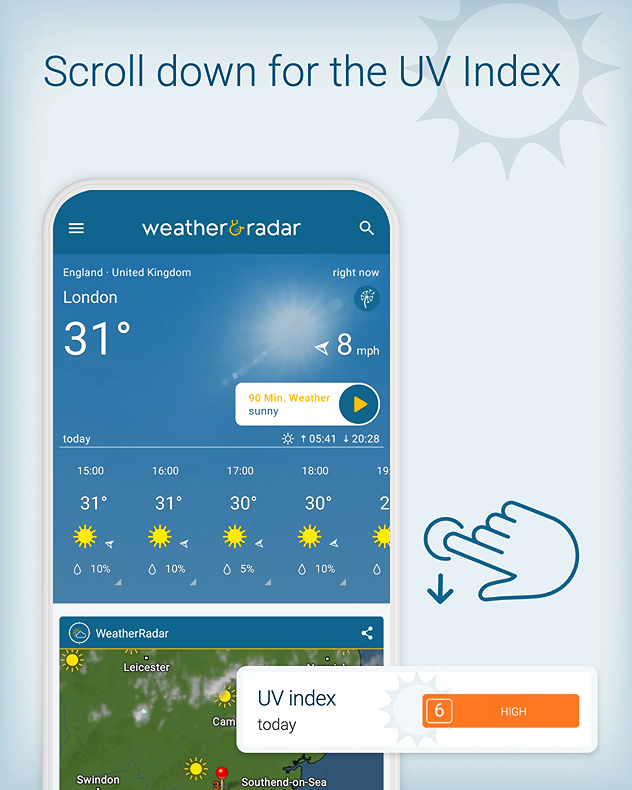
Weather app screen showing London forecast at 31 degrees with sunny icons and a prompt to scroll down for the UV index, highlighted with a hand icon and UV index 6 high panel.
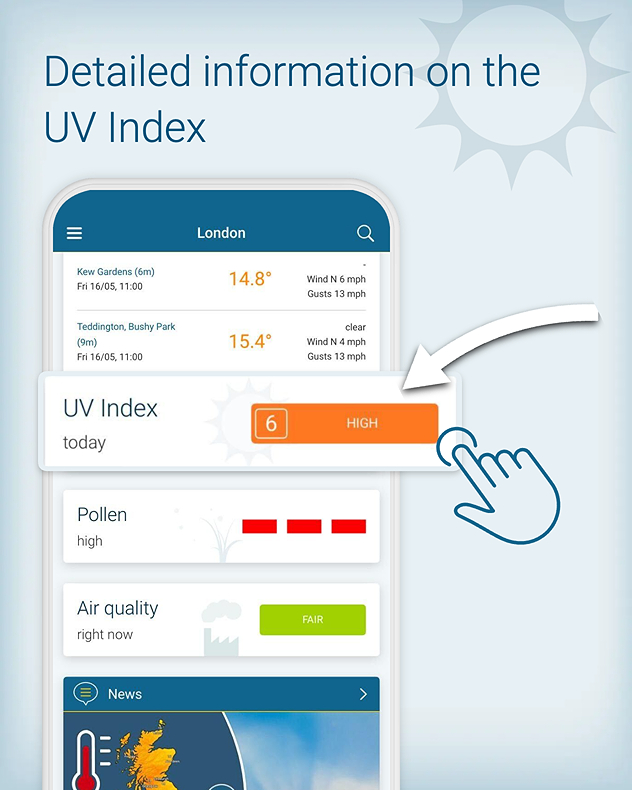
Mobile weather app screen showing detailed UV index for London with value 6 labeled high, alongside sections for pollen high and air quality fair, with a hand icon selecting the UV panel.
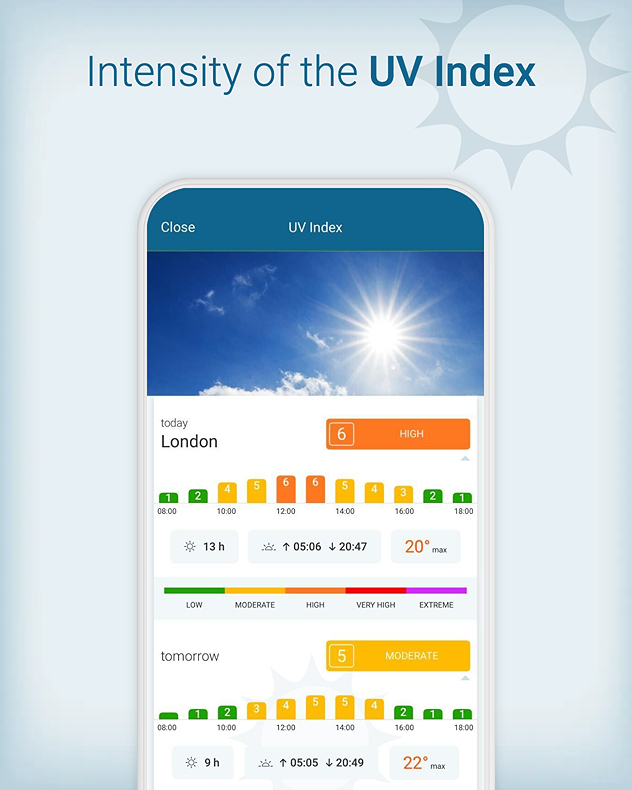
Mobile app screen showing UV index intensity for London with a peak value of 6 labeled high, hourly color scale from low to high, and bright sun image above.
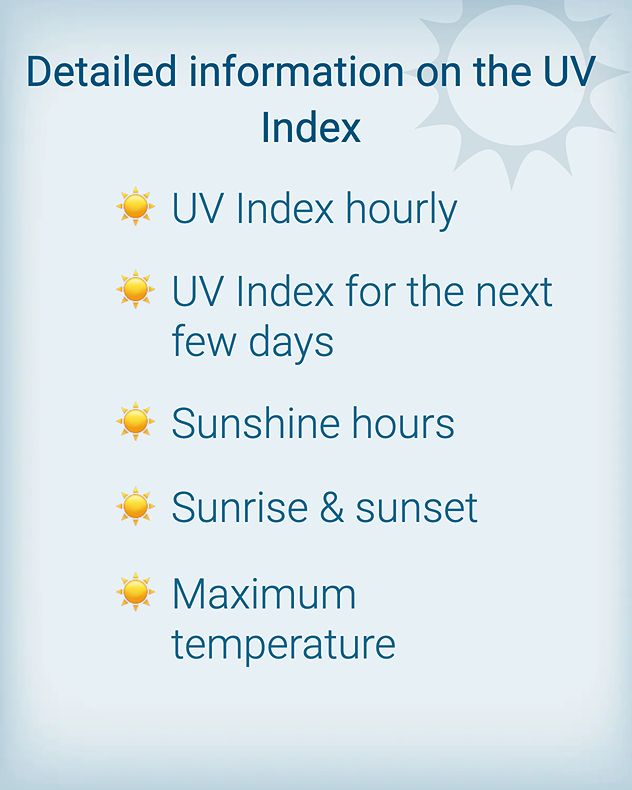
Informational graphic listing UV index features including hourly index, multi-day forecast, sunshine hours, sunrise and sunset times, and maximum temperature, with sun icons beside each item.
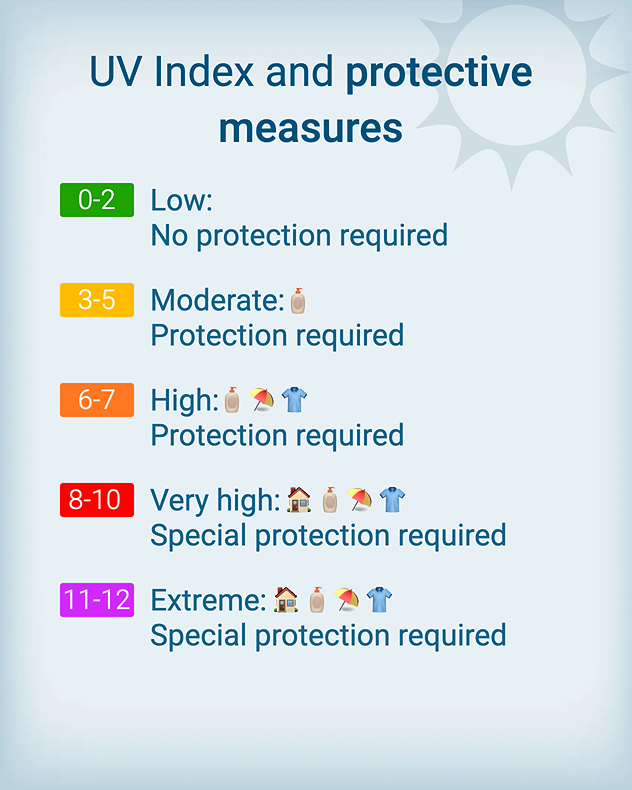
Infographic showing UV index scale from 0 to 12 with color bands and guidance, from low no protection to extreme requiring full protection, including sunscreen, shade, and clothing icons.
1/6
Ryan Hathaway
More on the topic
Hurricane threat off the coast of Mexico. Storm and rain. . . Monday, 21 September 2026
Split image showing a powerful tropical system southwest of Acapulco on a wind map and palm trees bending sharply in strong winds.
Monday, 21 September 2026

Storm and rain

Hurricane threat off the coast of Mexico
Hurricane POLO remains dangerous. Many storms in the Pacific. . . Thursday, 24 September 2026
Thursday, 24 September 2026

Many storms in the Pacific

Hurricane POLO remains dangerous
First taste of winter in the Alps. White mountain peaks. . . Friday, 25 September 2026
Winter scenery in the Alps along the Großglockner High Alpine Road
Friday, 25 September 2026

White mountain peaks

First taste of winter in the Alps
All weather news
This might also interest you
Historic Storm Éowyn arrives. On this day.... . . Saturday, 24 January 2026
Split image showing a person in a yellow jacket struggling against strong winds and heavy rain on a street at night on the left, and an Irish wind forecast map on the right with red and purple shading, gusts up to 75 mph, and a wind warning icon, divided by a curved white line.
Saturday, 24 January 2026

On this day...

Historic Storm Éowyn arrives
Storm Chandra makes impact. Severe gales & heavy rain. . . Tuesday, 27 January 2026
Split image showing strong winds over the UK on a forecast map and widespread rain and snow on a weather radar map.
Tuesday, 27 January 2026

Severe gales & heavy rain

Storm Chandra makes impact
Super Typhoon Bavi threatens Taiwan. Up to 1,000 mm of rain. . . Wednesday, 8 July 2026
The image shows an intense tropical cyclone over the western Pacific, east of Taiwan and the Philippines. The centre of the system is depicted as a light purple and white vortex with a clearly visible eye, surrounded by a ring of red and orange areas indicating the strongest wind speeds. A white arrow marks the typhoon’s predicted track towards the north-west, in the direction of Taiwan. To the west of the storm lie the Philippines, with the cities of Manila and Cebu; to the north of these lies Taiwan, with Taipei. Further west, the Chinese coast, including Hong Kong, and parts of Vietnam can be seen. The coloured wind map shows predominantly green areas outside the storm’s core, indicating significantly weaker winds. White streamlines illustrate the typhoon’s anti-clockwise circulation in the Northern Hemisphere. The highest wind speeds are concentrated around the eye of the cyclone.
Wednesday, 8 July 2026

Up to 1,000 mm of rain

Super Typhoon Bavi threatens Taiwan
All articles
Weather & Radar

Weather & Radar is also available on

Google Play StoreApp Store

Company

Contact us Privacy Policy Legal info Accessibility statement

Services

Uploader

Socials

facebooktwittertikToklinkList