Home
Weather London
WeatherRadar
RainfallRadar
TemperatureRadar
WindRadar
LightningRadar
Weather News
Editor's Pick
Discover the app
Weather widget
Contact us
Apps
Career
    Home / Editor's Pick /

    New heat record in the North Sea – lots of rain in sight

09:00
11 September 2025

Lots of rain in sight
New heat record in the North Sea

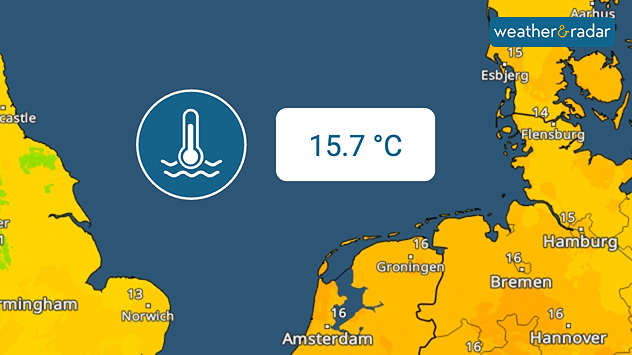
The average surface temperature of the North Sea was 15.7 degrees between June and August.

The North Sea was warmer than ever recorded in the summer of 2025, with an average temperature of 15.7 degrees, around two degrees above the long-term average.

The surface water was particularly warm in the western and southwestern North Sea up to the English Channel. Towards the east, in the areas off Denmark and Norway, the deviation was around 1.3 degrees.

Recording history

Temperature records for the North Sea have been measured since 1969.

Heavy rainfall on the coasts

In autumn, heavy rainfall often occurs on the coasts and over the sea. This is due to the still warm water and the cool air above it.

The temperature difference causes numerous showers to develop. Local wind conditions along the coast can further intensify this effect.

This means that there will be repeated rainfall in the North Sea region until the weekend. At times, there will even be heavy showers and thunderstorms.

Dennis Oswald
Ryan Hathaway
More on the topic
Heat becoming a bigger factor in drought. New study. . . Thursday, 23 July 2026
A hand holds dry, dusty earth above a parched field. The ground is cracked and covered with plant debris – a sign of prolonged drought.
Thursday, 23 July 2026

New study

Heat becoming a bigger factor in drought
Typhoon warning for China. Up to 500 mm of rain. . . Friday, 24 July 2026
Weather map of the southern Chinese coast and Taiwan showing a powerful tropical cyclone. The eye of the storm is located near the coastal city of Shantou in the Chinese province of Guangdong. Around the centre, intense shades of red, pink and violet indicate gale-force winds, whilst a large orange wind field extends as far as the west coast of Taiwan. An overlaid windsack warning sign indicates dangerous storm winds. Cities such as Hong Kong, Guangzhou, Xiamen, Taipei and Taichung are shown, as are wind speeds and white flow lines illustrating the cyclonic air circulation.
Friday, 24 July 2026

Up to 500 mm of rain

Typhoon warning for China
UV levels peak with the heat today. Latest heatwave. . . Wednesday, 29 July 2026
Split graphic showing a temperature map of England and eastern Ireland with temperatures reaching 33°C near London, 32°C in Norwich, and 29°C around Birmingham on the left, alongside a person applying sunscreen with a UV icon on the right.
Wednesday, 29 July 2026

Latest heatwave

UV levels peak with the heat today
All weather news
This might also interest you
New records for England and Wales. Broken again tomorrow?. . . Thursday, 25 June 2026
Temperature map of southwest Britain on 25.06 showing extreme heat across southern Wales and southwest England, with Bute Park in Cardiff highlighted at 34.2°C and Yeovilton at 36.4°C amid widespread deep red heat zones.
Thursday, 25 June 2026

Broken again tomorrow?

New records for England and Wales
A frozen start to the weekend. Icy conditions. . . Friday, 13 February 2026
UK temperature map dated 14.02 showing widespread subzero values in blue shading, with readings such as −4 in Glasgow, −3 in Dublin, and −2 in London, alongside a blue thermometer icon.
Friday, 13 February 2026

Icy conditions

A frozen start to the weekend
Super Typhoon Bavi threatens Taiwan. Up to 1,000 mm of rain. . . Wednesday, 8 July 2026
The image shows an intense tropical cyclone over the western Pacific, east of Taiwan and the Philippines. The centre of the system is depicted as a light purple and white vortex with a clearly visible eye, surrounded by a ring of red and orange areas indicating the strongest wind speeds. A white arrow marks the typhoon’s predicted track towards the north-west, in the direction of Taiwan. To the west of the storm lie the Philippines, with the cities of Manila and Cebu; to the north of these lies Taiwan, with Taipei. Further west, the Chinese coast, including Hong Kong, and parts of Vietnam can be seen. The coloured wind map shows predominantly green areas outside the storm’s core, indicating significantly weaker winds. White streamlines illustrate the typhoon’s anti-clockwise circulation in the Northern Hemisphere. The highest wind speeds are concentrated around the eye of the cyclone.
Wednesday, 8 July 2026

Up to 1,000 mm of rain

Super Typhoon Bavi threatens Taiwan
All articles
Weather & Radar

Weather & Radar is also available on

Google Play StoreApp Store

Company

Contact us Privacy Policy Legal info Accessibility statement

Services

Uploader

Socials

facebooktwittertikToklinkList