Home
Weather London
WeatherRadar
RainfallRadar
TemperatureRadar
WindRadar
LightningRadar
Weather News
Editor's Pick
Discover the app
Weather widget
Contact us
Apps
Career
    Home / Editor's Pick /

    Droughts and floods: Global consequences of El Niño

08:00
25 November 2023

Droughts and floods
Global consequences of El Niño

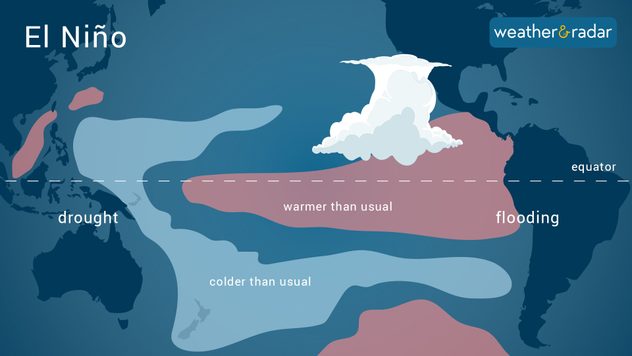
Here, the central and eastern Pacific warms, experiencing more rainfall than normal, while the western Pacific cools and sees drier conditions.

We are in the midst of an El Niño year. This will have a global impact on the weather in the coming months.

The El Niño climate phenomenon is currently approaching its peak. Among other things, it is characterised by a warming of the sea surface temperatures in the Pacific. Currently there, it is as much as 2 degrees warmer than the climate average.

This has knock-on consequences for many parts of the world, some of which are already visible. Some parts of the world will see enhanced rainfall, others drought.

Consequences not only for the Pacific

Some countries bordering the Pacific, such as Peru, Australia and Indonesia, are often the hardest hit. However, El Niño has also had significant effects in Africa in past events.

In the Horn of Africa, for example in Somalia, there have been repeated torrential downpours and flooding. Just a few days ago, over 100 people died in floods there. This was preceded by one of the worst droughts in decades.

Impacts in the Horn of Africaread more

Theories on the origin of El Niño

There is still speculation about the causes of the El Niño phenomenon. Some researchers attribute its origin to solar flares.

These are accompanied by huge discharges of energy on the surface of the sun. We are currently in a phase of high solar activity. This is also one reason why we are currently seeing more auroras.

Weather & Radar editorial team
More on the topic
Europe's summer set to to break records. Extreme heat and drought. . . Tuesday, 11 August 2026
Split image showing a European heat map with temperatures reaching 39°C in France and Spain on the left, and a severely depleted river with exposed sandy banks beneath a bridge on the right.
Tuesday, 11 August 2026

Extreme heat and drought

Europe's summer set to to break records
Getting through the latest heatwave. Tips to beat the heat. . . Tuesday, 11 August 2026
Split graphic showing temperatures up to 35°C in England and 28°C in Ireland beside a person applying sunscreen, with a heat warning symbol highlighting hot weather.
Tuesday, 11 August 2026

Tips to beat the heat

Getting through the latest heatwave
The best views of the solar eclipse. Across Europe. . . Thursday, 13 August 2026
Solar eclipse: The sun obscured between wind turbines in Sardinia
Thursday, 13 August 2026

Across Europe

The best views of the solar eclipse
All weather news
This might also interest you
Turbulent weather in the Canary Islands. Storm and rain. . . Friday, 12 December 2025
Weather graphic showing rain and wind fields over the Canary Islands and a central warning symbol.
Friday, 12 December 2025

Storm and rain

Turbulent weather in the Canary Islands
Storm Chandra makes impact. Severe gales & heavy rain. . . Tuesday, 27 January 2026
Split image showing strong winds over the UK on a forecast map and widespread rain and snow on a weather radar map.
Tuesday, 27 January 2026

Severe gales & heavy rain

Storm Chandra makes impact
Super Typhoon Bavi threatens Taiwan. Up to 1,000 mm of rain. . . Wednesday, 8 July 2026
The image shows an intense tropical cyclone over the western Pacific, east of Taiwan and the Philippines. The centre of the system is depicted as a light purple and white vortex with a clearly visible eye, surrounded by a ring of red and orange areas indicating the strongest wind speeds. A white arrow marks the typhoon’s predicted track towards the north-west, in the direction of Taiwan. To the west of the storm lie the Philippines, with the cities of Manila and Cebu; to the north of these lies Taiwan, with Taipei. Further west, the Chinese coast, including Hong Kong, and parts of Vietnam can be seen. The coloured wind map shows predominantly green areas outside the storm’s core, indicating significantly weaker winds. White streamlines illustrate the typhoon’s anti-clockwise circulation in the Northern Hemisphere. The highest wind speeds are concentrated around the eye of the cyclone.
Wednesday, 8 July 2026

Up to 1,000 mm of rain

Super Typhoon Bavi threatens Taiwan
All articles
Weather & Radar

Weather & Radar is also available on

Google Play StoreApp Store

Company

Contact us Privacy Policy Legal info Accessibility statement

Services

Uploader

Socials

facebooktwittertikToklinkList