Home
Weather London
WeatherRadar
RainfallRadar
TemperatureRadar
WindRadar
LightningRadar
Weather News
Editor's Pick
Discover the app
Weather widget
Contact us
Apps
Career
    Home / Weather News /

    Death Valley smashes rainfall record

17:00
9 August 2022

0.1% chance of happening
Death Valley smashes rainfall record

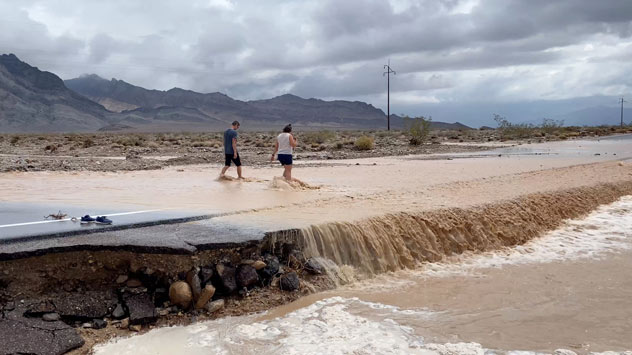
Monsoonal rain hits Death Valley
Monsoonal rain flooded Death Valley Friday, August 5, 2022. - © picture alliance

The world’s hottest and North America’s driest place just experienced a 1 in 1,000-year event, and not because of the heat.

Death Valley, California, the world record holder for the highest air temperature, broke another record this past weekend, but for rainfall. Sitting near the border of Nevada, Death Valley does receive showers and thunderstorms thanks to the Southwest Monsoon, but on Friday, history was made.

A record 37mm of rain inundated the desert at Furnace Creek Visitors Center in three hours. This smashed the previous August 5th 24-hour rainfall record of 28mm of rainfall from 1936 – 86 years ago.

This amount of rain that fell was almost a year’s worth within the space of just a few hours, as Furnace Creek gets around 49.7mm of rain a year on average. The all-time record for a 24-hour period at Furnace Creek in Death Valley is 37.3mm, set back in April 1988 for Furnace Creek – a narrow miss from Friday’s record.

Flash flooding quickly ensued sending rushing water and debris down the roadways. According to the National Park Service, 1,000 people, residents and visitors were trapped in the park until the flood waters dissipated. Rocks and boulders were included in the water flow.

Privacy Policy

Widespread damage was reported by the park service and park roads will be closed for some time. This event ended up being a 1 in 1,000-year event, meaning there is a 0.1% chance of this happening during any given year.

Other parts of the US, including Denver, Colorado and St. Louis, Chicago have also dealt with historic flooding in the last two weeks.

More on the topic
Very high UV levels during the heatwave. Sun cream at the ready!. . . Wednesday, 8 July 2026
Split graphic showing a UK temperature map with hot conditions across England and Wales, temperatures reaching 32 °C near London, and a UV warning icon on the left, alongside a person applying sunscreen in bright sunshine on the right.
Wednesday, 8 July 2026

Sun cream at the ready!

Very high UV levels during the heatwave
Lee waves flow over the UK and Ireland. On the WeatherRadar. . . Monday, 6 July 2026
Satellite weather map of the UK and Ireland showing parallel bands of low cloud highlighted over southern Scotland and northern England, with additional cloud streets over Wales and western England circled in white.
Monday, 6 July 2026

On the WeatherRadar

Lee waves flow over the UK and Ireland
The monsoon has India firmly in its grip. Severe thunderstorms. . . Thursday, 9 July 2026
Satellite map of South Asia showing the weather situation over India. An arrow marks a low-pressure system over western and central India, which is causing heavy showers and thunderstorms. Thick clouds and rainfall extend across large parts of India as far as the Himalayas and into Bangladesh. Over Pakistan and south-eastern Iran, however, it is mainly sunny and hot, with temperatures exceeding 40 degrees.
Thursday, 9 July 2026

Severe thunderstorms

The monsoon has India firmly in its grip
All weather news
This might also interest you
New records for England and Wales. Broken again tomorrow?. . . Thursday, 25 June 2026
Temperature map of southwest Britain on 25.06 showing extreme heat across southern Wales and southwest England, with Bute Park in Cardiff highlighted at 34.2°C and Yeovilton at 36.4°C amid widespread deep red heat zones.
Thursday, 25 June 2026

Broken again tomorrow?

New records for England and Wales
Super Typhoon Bavi threatens Taiwan. Up to 1,000 mm of rain. . . Wednesday, 8 July 2026
The image shows an intense tropical cyclone over the western Pacific, east of Taiwan and the Philippines. The centre of the system is depicted as a light purple and white vortex with a clearly visible eye, surrounded by a ring of red and orange areas indicating the strongest wind speeds. A white arrow marks the typhoon’s predicted track towards the north-west, in the direction of Taiwan. To the west of the storm lie the Philippines, with the cities of Manila and Cebu; to the north of these lies Taiwan, with Taipei. Further west, the Chinese coast, including Hong Kong, and parts of Vietnam can be seen. The coloured wind map shows predominantly green areas outside the storm’s core, indicating significantly weaker winds. White streamlines illustrate the typhoon’s anti-clockwise circulation in the Northern Hemisphere. The highest wind speeds are concentrated around the eye of the cyclone.
Wednesday, 8 July 2026

Up to 1,000 mm of rain

Super Typhoon Bavi threatens Taiwan
A frozen start to the weekend. Icy conditions. . . Friday, 13 February 2026
UK temperature map dated 14.02 showing widespread subzero values in blue shading, with readings such as −4 in Glasgow, −3 in Dublin, and −2 in London, alongside a blue thermometer icon.
Friday, 13 February 2026

Icy conditions

A frozen start to the weekend
All articles
Weather & Radar

Weather & Radar is also available on

Google Play StoreApp Store

Company

Contact us Privacy Policy Legal info Accessibility statement

Services

Uploader

Socials

facebooktwittertikToklinkList