Home
Weather London
WeatherRadar
RainfallRadar
TemperatureRadar
WindRadar
LightningRadar
Weather News
Editor's Pick
Discover the app
Weather widget
Contact us
Apps
Career
    Home / Editor's Pick /

    AQI: Saharan dust impacts air quality

AQI
Saharan dust impacts air quality

Saharan dust can be tracked with Air Quality Index maps.

Saharan dust is often transported northward from the desert to the UK and Ireland, and it has an impact on our air quality.

Strong winds over North Africa can stir up large amounts of dust, with long-range transport of high concentrations affecting parts of Northern Europe for several days.

Check the AQI inside the app for your location now!

On some occasions, the dust travels far enough north to make a noticeable impact on us in the UK and Ireland. With vivid sunsets as sunlight hits the dust, and also a hit to air quality with particulates growing in number.

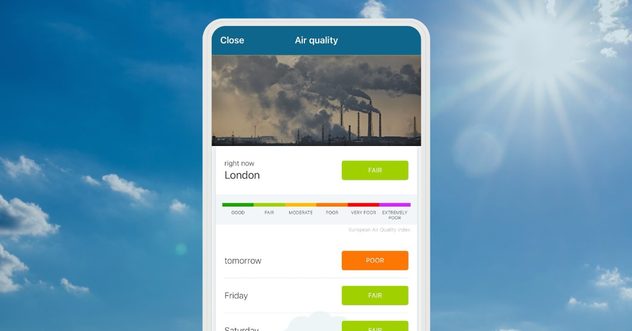
During one event, according to our Air Quality Index (AQI) which you can find inside the app if you scroll down below the UV Index and Pollen, the air quality dropped to moderate or poor in places.

How to use the AQI featureread more

If rain coincides with the dust, there may even be spots of “blood rain”. “Blood rain” is when the Saharan dust is precipitated out of the air and falls to the ground with the raindrops.

Dust deposits may be noticeable on your cars, so don't bother with a car wash today! Check the WeatherRadar to see exactly where it may rain.

A more positive result of the dust in our air are the intense and vivid colours are possible during sunset and sunrise so next time it happens don't forget to send in your shots for us to feature!

This might also interest you
Typhoon warning for China. Up to 500 mm of rain. . . Friday, 24 July 2026
Weather map of the southern Chinese coast and Taiwan showing a powerful tropical cyclone. The eye of the storm is located near the coastal city of Shantou in the Chinese province of Guangdong. Around the centre, intense shades of red, pink and violet indicate gale-force winds, whilst a large orange wind field extends as far as the west coast of Taiwan. An overlaid windsack warning sign indicates dangerous storm winds. Cities such as Hong Kong, Guangzhou, Xiamen, Taipei and Taichung are shown, as are wind speeds and white flow lines illustrating the cyclonic air circulation.
Friday, 24 July 2026

Up to 500 mm of rain

Typhoon warning for China
Icy spells in the Southern Hemisphere. Snow in the Andes. . . Tuesday, 28 July 2026
A composite image showing a temperature radar map of South America and a snow-covered town in Chile. The winter cold is bringing heavy snowfall to the Andes and, in some areas, snow down to lower altitudes.
Tuesday, 28 July 2026

Snow in the Andes

Icy spells in the Southern Hemisphere
Heavier rainfall over the week for some. Ireland & Scotland. . . Tuesday, 28 July 2026
Split image showing a Europe rainfall accumulation forecast map on the left with the highest totals across the UK, Ireland, and Scandinavia, and a satellite weather map on the right with a broad band of rain stretching across Ireland, Scotland, and northern Britain, highlighted by a rain cloud icon.
Tuesday, 28 July 2026

Ireland & Scotland

Heavier rainfall over the week for some
All articles
Weather & Radar

Weather & Radar is also available on

Google Play StoreApp Store

Company

Contact us Privacy Policy Legal info Accessibility statement

Services

Uploader

Socials

facebooktwittertikToklinkList